
"Style and aesthetics cannot rescue failed content. If the are not truthful the most appealing fonts wont’ turn lies into truth." -- Edward Tufte, Yale University
"Humans have a powerful capacity to process visual information, skills that date far back in our evolutionary lineage.
And since the advent of science, we have employed intricate visual strategies to communicate data, often utilizing design principles that draw on these basic cognitive skills. In a modern world where we have far more data than we can process, the practice of data visualization has gained even more importance. From scientific visualization to pop infographics, designers are increasingly tasked with incorporating data into the media experience. Data has emerged as such a critical part of modern life that it has entered into the realm of art, where data-driven visual experiences challenge viewers to find personal meaning from a sea of information, a task that is increasingly present in every aspect of our information-infused lives."
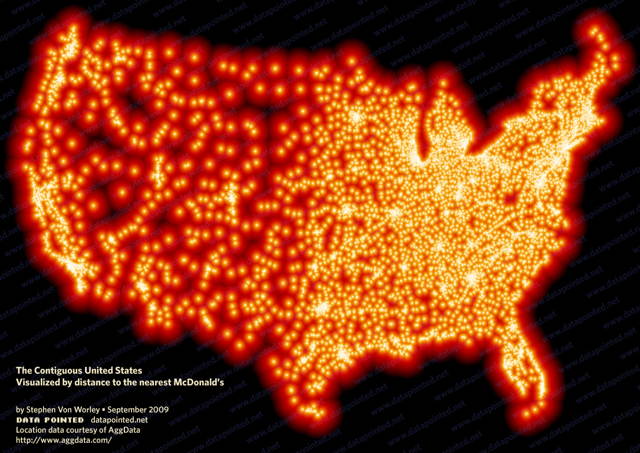
Where The Buffalo Roamed – How Far Can You Get From McDonald's? FOR MAXIMUM MCSPARSENESS, we look westward, towards the deepest, darkest holes in our map: the barren deserts of central Nevada, the arid hills of southeastern Oregon, the rugged wilderness of Idaho’s Salmon River Mountains, and the conspicuous well of blackness on the high plains of northwestern South Dakota....
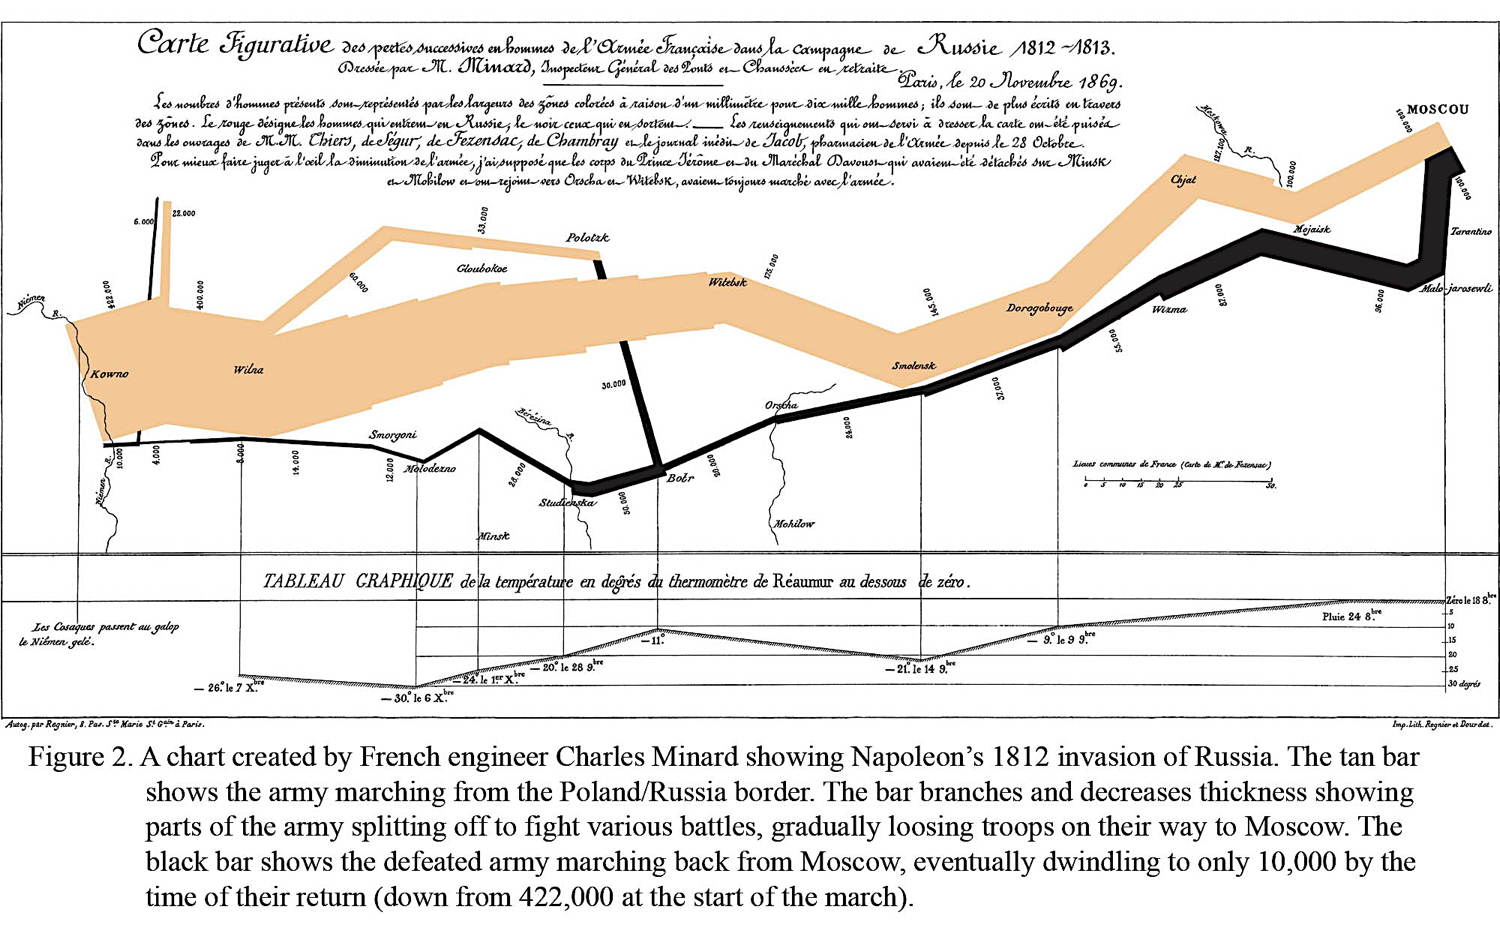
Then there's always "Charles Joseph Minard who was a pioneer of the use of graphics in engineering and statistics. He is famous for his Carte figurative des pertes successives en hommes de l'Armee Francaise dans la campagne de Russie 1812-1813, a flow map published in 1869 on the subject of Napoleon's disastrous Russian campaign of 1812. The graph displays several variables in a single two-dimensional image:
See it large along with a Facebook map of the world in 2013....
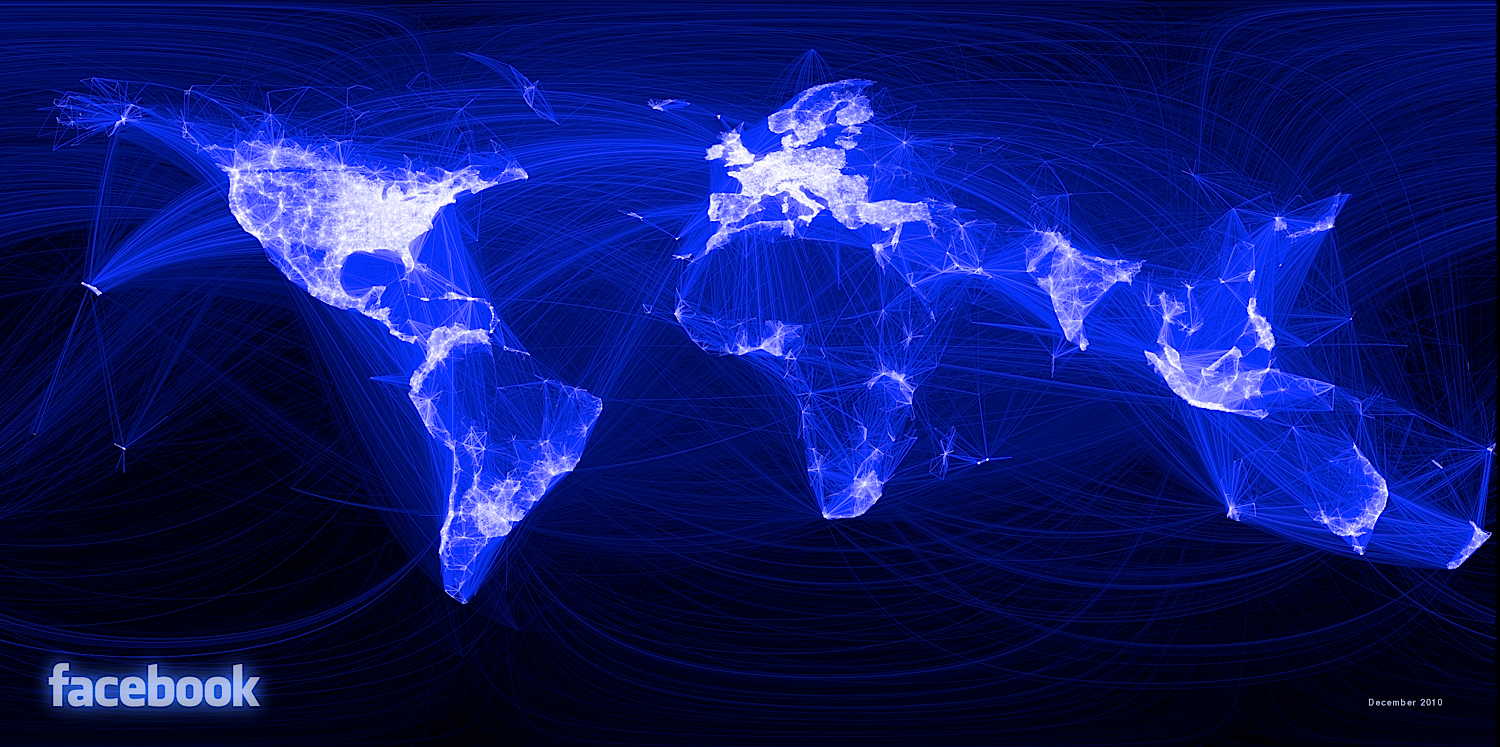
Facebook Draws a Map of the Connected World — Tech News and Analysis When you have almost 600 million users and a “social graph” of the connections between them, you can do a lot with that data — so a Facebook intern plotted the connections between millions of users and came up with a map of the socially connected world.
In the Salmon River Darkness you will find a campfire with a good steak, hamburger, fried trout or salmon. In the morning over the same fire bacon, eggs, pancakes and coffee. McDonalds is the last thing on your mind.
Posted by: Revernd Idaho Spud at May 16, 2013 10:07 PMIn the Salmon River Darkness you will find a campfire with a good steak, hamburger, fried trout or salmon. In the morning over the same fire bacon, eggs, pancakes and coffee. McDonalds is the last thing on your mind.
Posted by: Revernd Idaho Spud at May 16, 2013 10:08 PM
HOME