The map above (click to enlarge) shows three geographical regions of the US by counties that each account for one-third of the COVID-19 deaths as of about May 8:
The red region shows the area of the US that represents one-third of COVID deaths in counties that account for only 4% of the US population.
The yellow region shows the area that represents one-third of COVID deaths in counties that account for only 11% of the US population.
The green area shows the area that represents one-third of COVID deaths in counties that account for 85% of the US population.
If we can’t call it the Wuhan Virus or the CCP Virus, can we call it the ACELA Corridor Virus?
Anonymous Coward 3265May 31, 2020, 4:00 PM
You’re welcome.
At the risk of being That Guy ™, Prof. Perry also presents two other recent COVID graphics at the AEI site, though if you look at this one https://www.aei.org/carpe-diem/animated-chart-of-the-day-top-10-global-causes-of-deaths-in-2020/
it can appear to “prove” something very different. Of course it’s showing global rate-of-change rather than hot spots in the US, which is not the same thing at all.
I recommend the old classic “How To Lie With Statistics” by Darrell Huff, available for free here on archive.org, https://archive.org/details/how-to-lie-with-statistics-darrell-huff/page/7/mode/2up
and designed to show everyday folks just how statistical presentation, normally with graphics, can manipulate impressions — which are normally what’s being sold. And since it was published in 1954, the occasional examples using pay scales are kind of a hoot.
Further deponent sayeth not.
AC Out.
gmarvMay 31, 2020, 4:21 PM
Thanks for the links .
ghostsniperJune 1, 2020, 4:38 AM
Another massive scam, each bigger than the one before.
Was out and about yesterday, lots of traffic of every kind, but not a mask in sight.
Like a fart in the wind…..
Real World Address for Donations, Mash Notes and Hate Mail
Gerard Van der Leun
1692 MANGROVE AVE
APT 379
Chico, Ca 95926
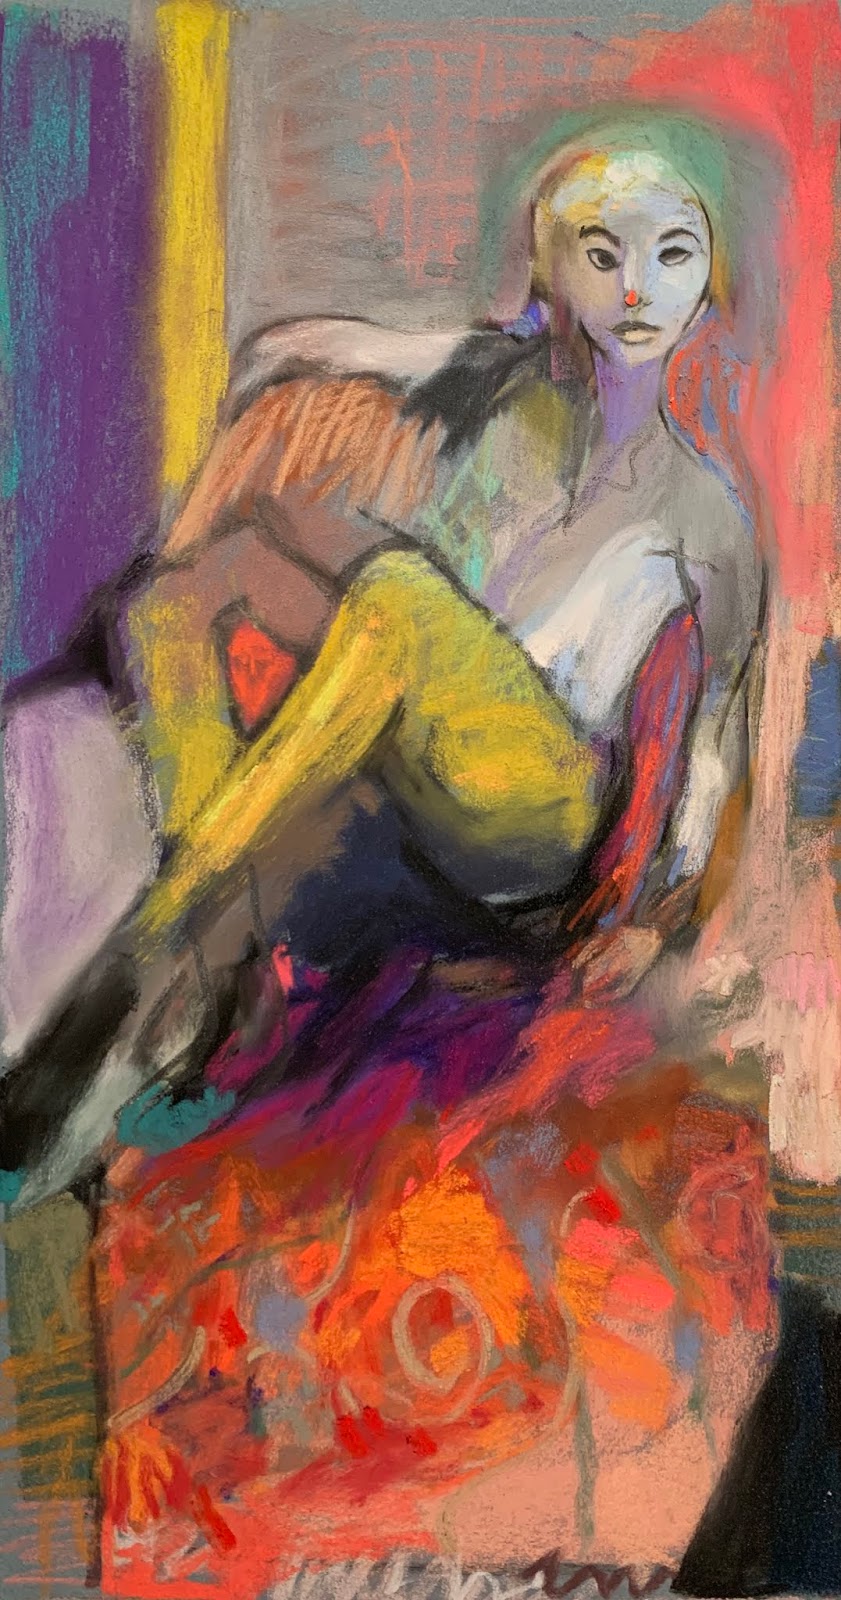
Green Pants Interior by Klahn
Who Am I? by Carl Sandburg
My head knocks against the stars.
My feet are on the hilltops.
My finger-tips are in the valleys and shores of universal life.
Down in the sounding foam of primal things I reach my hands and play with pebbles of destiny.
I have been to hell and back many times.
I know all about heaven, for I have talked with God.
I dabble in the blood and guts of the terrible.
I know the passionate seizure of beauty
And the marvelous rebellion of man at all signs reading “Keep Off.”
My name is Truth and I am the most elusive captive in the universe.
Duty, Beauty, Liberty, Country, Honor, Family, Faith — Plus a few simple easy to follow rules for guys
Men saw the stars at the edge of the sea
They thought great thoughts about liberty
Poets wrote down words that did fit
Writers wrote books
Thinkers thought about it
Take it where you find it
Can’t leave it alone
You will find a purpose
To carry it on
Mainly when you find it
Your heart will be strong
About it
Many’s the road I have walked upon
Many’s the hour between dusk and dawn
Many’s the time
Many’s the mile
I see it all now
Through the eyes of a child
Take it where you find it
Can’t leave it alone
You will find a purpose
To carry it on
Mainly when you find it
Your heart will be strong
About it
[Chorus]
Lost dreams and found dreams
In America
In America
In America
Lost dreams and found dreams
In America
In America
In America
And close your eyes
Leave it all for a while
Leave the world
And your worries behind
You will build on whatever is real
And wake up each day
To a new waking dream
Take it where you find it
Can’t leave it alone
You will find a purpose
To carry it on
Mainly when you find it
Your heart will be strong
About it
[Chorus]
Change, change come over
Change come over
Talkin’ about a change
Change, change
Change come over, now
Change, change, change come over
I’m gonna walk down the street
Until I see
My shining light
I’m gonna walk down the street
Until I see
My shining light
I’m gonna walk down the street
Until I see
My shining light
I’m gonna walk down the street
Until I see
My shining light
I see my light
See my light
See my shining light
I see my light
See my light
See my shining light


 PLUS Christianity Yesterday, Today, and Tomorrow: A Discussion")


 Gerard Van der Leun


Comments on this entry are closed.
Interesting and unsurprising. What’s the source of the graphic?
Absolutely correct. Thanks..
I would like the source of the map so that I can share it also.
Graphic source is apparently Mark J. Perry at AEI.
Link:
https://www.aei.org/carpe-diem/map-of-the-day-us-population-divided-by-one-thirds-of-covid-deaths/
THANKS AC. Updated.
If we can’t call it the Wuhan Virus or the CCP Virus, can we call it the ACELA Corridor Virus?
You’re welcome.
At the risk of being That Guy ™, Prof. Perry also presents two other recent COVID graphics at the AEI site, though if you look at this one
https://www.aei.org/carpe-diem/animated-chart-of-the-day-top-10-global-causes-of-deaths-in-2020/
it can appear to “prove” something very different. Of course it’s showing global rate-of-change rather than hot spots in the US, which is not the same thing at all.
I recommend the old classic “How To Lie With Statistics” by Darrell Huff, available for free here on archive.org,
https://archive.org/details/how-to-lie-with-statistics-darrell-huff/page/7/mode/2up
and designed to show everyday folks just how statistical presentation, normally with graphics, can manipulate impressions — which are normally what’s being sold. And since it was published in 1954, the occasional examples using pay scales are kind of a hoot.
Further deponent sayeth not.
AC Out.
Thanks for the links .
Another massive scam, each bigger than the one before.
Was out and about yesterday, lots of traffic of every kind, but not a mask in sight.
Like a fart in the wind…..